Reduction of Carbon Emissions in Logistics

Reduction of Greenhouse Gas Emissions for a Healthier World
According to the US Environmental Protection Agency, the transportation sector is the largest contributor to US Greenhouse Gas (GHG) Emissions [1] (Figure 1). While this includes all cars, rail, truck, and air travel, medium- and heavy-duty trucks used for logistics transportation traveled 317,245 million miles in 2020, making this source the second highest contributor to the overall sector GHG [2] (Figure 2).
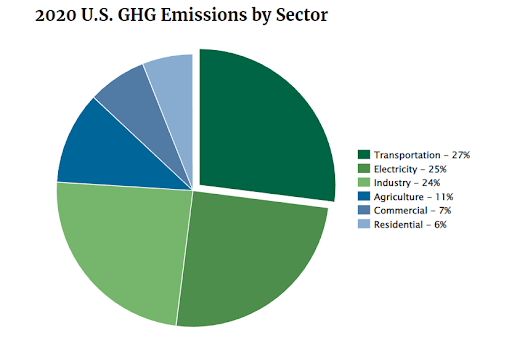
2020 U.S. GHG Emissons by Sector
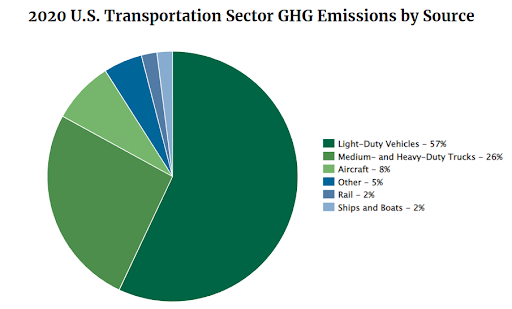
2020 U.S. Transportation Sector GHG Emissons by Source
Mitigate Carbon Dioxide Emissions and Realize Cost Savings
The average trucker drives about 120,000 miles per year (400 miles per day, six days a week, 50 weeks per year) and averages about 6.5 miles per gallon of diesel fuel. Commercial Fleet’s calculator found the average truck’s carbon footprint to be 201,834 kilograms or 223 tons of carbon dioxide [3]. For every truck removed from the road, carbon dioxide (CO2) emissions are significantly reduced.
So, what lever can a supply chain manager begin to pull to reduce the overall CO2 emissions released due to their supply chain? One option is the efficiency of use, which lies completely in the shipper’s control. Optimal efficiency is achieved when the container both weighs and cubes out. These two attributes rarely intersect to form the perfect load. However, reduction in CO2 emissions and savings opportunities lie in the gap between the current load configuration and a future, more efficient composition.
This approach requires a thorough review of the supply chain transportation network and a full understanding of the current pallet configurations and packaging performance capability.
Minimize Carbon Dioxide Emissions with ALOE Group
At ALOE Group, our team will lead this approach. We will evaluate the current packaging and pallet configuration profiles and compare the results to multiple predictive alternative structures. This will result in more cases per pallet, leading to more cases per container. Normalizing for volume results in fewer trucks needed in aggregate. Reduced CO2 emission and savings calculations are generated based on the reduction of trucks per lane for each stock keeping unit (SKU) involved.
ALOE Group will also consider, evaluate and verify the packaging implications of changing the cases per layer or layers per pallet. Our team understands static and dynamic top loads and pallet stability to ensure product integrity during shipment. ALOE Group leverages the package engineering resources of its parent, Stress Engineering Services, to evaluate performance and compare it to current pallet and packaging performance. This work is typically done on your manufacturing site, with supplemental testing performed at the Mason, OH labs.
Maximizing container efficiency reduces the use of ground transportation which in turn reduces CO2 emissions. These results are part of larger cost savings along with reduced SKU transactions.
References: